Modeling SaaS Event Streams as Analysis-Ready Fact Tables
Grain, additivity, and fact type prevent silent SaaS analytics failures.
A dashboard built on raw SaaS event data can return a number that looks entirely plausible and is entirely wrong. The subject of this piece is the modeling discipline that prevents that outcome: turning operational event streams into fact tables that can be queried with confidence, using grain, fact type, and measure additivity as the three decisions that do the work. Each choice has to be made deliberately and in order, because getting any one of them wrong produces a table that answers questions incorrectly while looking like it answers them fine.
Raw SaaS event streams are not yet analytical data
An analyst runs a SUM against an events table and gets a monthly active user count four times larger than the true figure. The query executed without error. The columns were all there, the timestamps looked clean, and nothing in the warehouse flagged a problem. The number was simply wrong, and nothing about the schema warned anyone.
That failure traces back to where the data came from. None of these are edge cases. They are the normal shape of SaaS event data, and every one of them produces a silent failure mode: a SUM or COUNT returns a number, but that number double-counts in-progress events, misses late arrivals, or blends rows that belong to different grains.
The fix for this mismatch is dimensional modeling, specifically the fact table grammar laid out for exactly this problem: converting operational records into measures that can be trusted under aggregation. Kimball's four-step design process puts grain, dimensions, and facts at the center of that conversion, and the sequencing matters. Before any column gets typed or any join gets written, the table's designer has to decide what a row represents, what it can legitimately be summed with, and which of three structural patterns, transaction, periodic snapshot, or accumulating snapshot, the data actually fits. These three types are not stylistic variations on the same idea. Each one answers a different analytical question, and using the wrong one for a given SaaS event stream produces an answer that is confidently delivered and factually wrong.
Grain definition: the decision that every other modeling choice depends on
Grain is the declaration of what a single row in the fact table means, stated in business language before a single column gets named. "One row per page-view event." "One row per subscription per billing period." "One row per order at each fulfillment milestone." Every measure, every join, every aggregation that follows inherits its correctness from that one sentence. Get the grain wrong and no amount of careful SQL downstream will fix it.
The trap specific to SaaS data is that the source system already has a grain, and it is almost never the grain an analyst needs. Defining the grain correctly at modeling time, one row per distinct feature-use event after deduplication, does that work once.
Four grain mistakes show up repeatedly in SaaS contexts, visible in how teams define and document the fact table's rows. Pre-aggregating before the fact table is written is too coarse, and it throws away the atomic detail that cohort and funnel analysis depend on. And leaving the grain undocumented lets different teams interpret the same rows differently, which produces divergent metrics computed from identical source data.
A simple test catches most of these before the schema gets written. Can the table, as scoped, answer the business questions it was built for? If any answer comes back no, the grain needs to change before a single CREATE TABLE statement runs.
Transaction fact tables and the SaaS events that fit them
Transaction fact tables record one row per discrete event at the most atomic grain the business recognizes, and this pattern fits most SaaS behavioral and usage data because most of that data is genuinely immutable: a thing happened once, at a point in time, and it will never happen that same way again. Clickstream events, feature-usage events, each API call, each webhook delivery attempt, each audit log entry recording a permission change: all of these are discrete occurrences that do not get revised after the fact. They belong in a transaction fact table.
A feature-usage fact table makes the pattern concrete:
CREATE TABLE fact_feature_usage (
event_date_key      INT NOT NULL,       -- FK to dim_date
event_time_key      INT NOT NULL,       -- FK to dim_time
account_key         INT NOT NULL,       -- FK to dim_account
user_key            INT NOT NULL,       -- FK to dim_user
feature_key         INT NOT NULL,       -- FK to dim_feature
event_id            VARCHAR NOT NULL,   -- degenerate dimension
session_id          VARCHAR NOT NULL,   -- degenerate dimension
usage_count         INT NOT NULL
);
Transaction fact tables are the most permissive pattern when it comes to additivity. Quantity and amount measures in this pattern are fully additive: they can be summed across time, product, customer, or geography without restriction. Watch for fields that are numeric but not summable at all: unit price, rate, and ratio columns look like measures but behave like attributes, and putting them in the fact table as raw measure columns invites someone to SUM a price and call the result meaningful.
One variant of the transaction pattern deserves its own name: the factless fact table, where no numeric measure exists at all because the occurrence of the event is itself the fact worth recording. "User enabled dark mode" or "user is enrolled in plan X" are counted, never summed, and the table exists purely to answer questions of the form "how many accounts did this."
Periodic snapshot fact tables and recurring SaaS metrics
Some SaaS questions are not about individual events at all. "How many seats were active at the end of last month?" "What was MRR on the first of the quarter?" These are status questions, and a transaction fact table answers them only awkwardly, because it was built to record occurrences, not to report state. The periodic snapshot pattern exists specifically for this class of question: one row per entity per time period, written on a regular cadence regardless of whether anything happened to that entity during the period.
The contrast with the transaction pattern is sharp when the measure is MRR. Writing one row per subscription event and summing the MRR value on every row produces cumulative MRR, a running total of every event that ever touched that subscription, not the normalized recurring-contract run-rate at any single point in time. Treating it as something to accumulate across transaction rows produces a number large enough to look impressive and wrong enough to be useless. The periodic snapshot pattern fixes this by writing exactly one row per subscription per period, carrying the MRR value as of that period's close.
In every case, the row exists for every entity in every period regardless of whether that entity generated any activity, and the measure represents a state captured at that moment.
Semi-additivity is the constraint that defines this entire pattern. A measure like account balance, seat count, or MRR can be summed across customers at a single point in time and produce a meaningful total. Sum that same measure across time periods and the result has no business meaning, because you have added together snapshots of a quantity that was never meant to accumulate.
Building these tables from an event stream requires a scheduled job, a dbt snapshot, a Spark batch, or a warehouse-native scheduled task, that takes a point-in-time slice of current state and writes one row per entity for that period. Late-arriving events complicate this further: if a billing event for period N arrives after the period N snapshot has already been written, the table needs either a reprocessing strategy that rewrites the affected snapshot or an explicit as-of timestamp column that tells analysts the snapshot may not reflect everything that eventually happened in that period.
Accumulating snapshot fact tables and multi-stage SaaS processes
Some SaaS questions are about lag and conversion across a defined sequence of steps rather than about any single event or any single period: how long does it take a trial account to convert, how long does onboarding take from signup to first integration, how long does a support ticket sit before first response. The accumulating snapshot pattern is built for exactly this class of question, and it looks structurally different from both of the patterns above.
One row represents one instance of the process, one deal, one trial, one support ticket, and that row carries multiple date foreign keys, one for each milestone the process can reach. Those milestone columns start out NULL and get filled in as the corresponding event arrives: trial start, first login, feature adoption, conversion, churn, each with its own date key on the same row. A support ticket's row fills in opened, assigned, first response, resolved, and closed over what might be days or weeks, and once every milestone is populated, the lag between any two of them, time-to-first-response, time-to-resolution, becomes a straightforward calculation.
The consequence that distinguishes this pattern from the other two is that rows get updated, not appended. A trial-to-paid conversion row written the day a trial starts will be rewritten the day that trial converts, and rewritten again if the account later churns. That single structural fact creates a real tension for teams whose ingestion pipelines were built around the assumption that event streams are append-only, because an architecture tuned for appending new rows has to be reconciled with a table format that supports updating rows already written. That tension is a pipeline problem, and it's the subject the next section takes up directly.
CDC pipelines carrying SaaS events into each fact table pattern
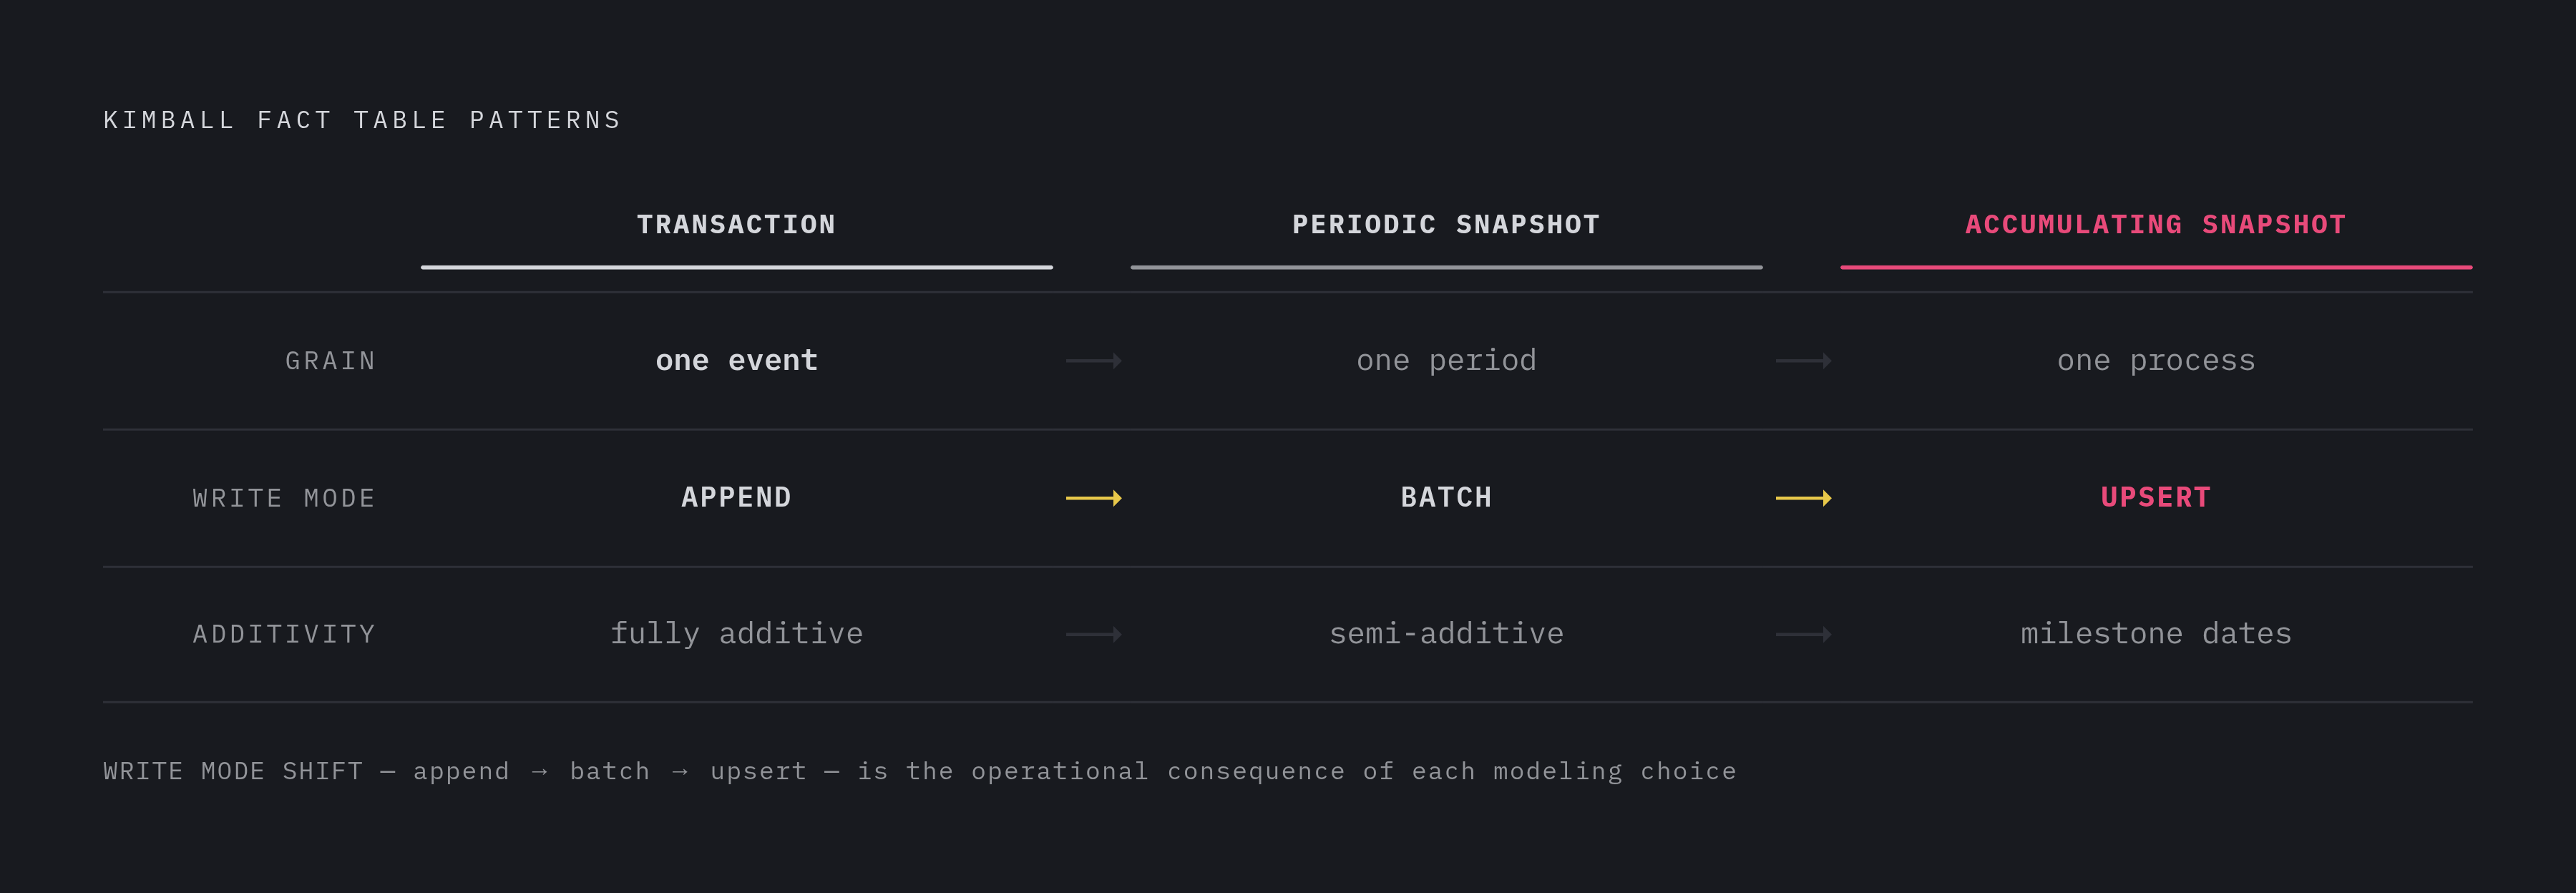
Each of the three fact table patterns imposes a different requirement on the pipeline feeding it, and the modeling decision made at design time becomes a concrete constraint on CDC configuration and lakehouse write strategy well before anyone writes a query against the finished table.
Transaction fact tables want append-only pipeline behavior: one new row per event, with change-log entries from the source system mapping directly onto new fact rows and no upsert logic required anywhere in the path. The pipeline's job is to get each event written once and get it written reliably, not to reconcile it against anything already in the table.
Periodic snapshot fact tables want a batch incremental pattern instead: a scheduled job that reads current state at period close rather than a stream that reacts to every individual change. SaaS application APIs that support filtering by modified timestamp are a natural source for this kind of job, and the pipeline doesn't need to capture every intermediate state a subscription or account passed through during the period. It only needs the state as of the moment the snapshot is taken.
Accumulating snapshots make the append-versus-upsert distinction a real engineering concern. Append-only writes work fine for transaction facts because no table format needs to support row-level updates, and compaction there is a performance tuning question, not a correctness requirement. Accumulating snapshots are upsert-heavy by design, since the same row gets rewritten every time the process it represents reaches a new milestone, and that write pattern needs a lakehouse table format capable of efficient row-level updates. Apache Iceberg is one table format built with update and delete support for exactly this reason.
A source database feeds a change-log reader, which publishes to an event stream, which a sink connector picks up and writes into a warehouse or lake, the architecture underneath all three patterns. What changes between fact table types is the sink connector's write mode. Append for transaction facts. Scheduled batch read for periodic snapshots. Matching that write mode to the target fact table type is the mechanism that makes the modeling decision real, not an implementation detail decided after the modeling is done.
Measure additivity as the analytical contract a fact table makes with its consumers
Additivity is a relationship between a measure and the grain of the table it lives in, and SaaS event streams generate measures that look perfectly summable while behaving nothing like it once they land in a warehouse.
Three classes cover the ground. Fully additive measures, event counts, row counts, payment amounts, can be summed across every dimension in the table without restriction: time, customer, product, geography, any direction a query wants to aggregate. Semi-additive measures, account balance, seat count, inventory on hand, MRR, can be summed across customers or accounts at a single point in time but never across time periods; summing an account balance across all your customers on a given day tells you something real, while summing that same balance across twelve months of snapshots tells you nothing.
Storing monthly active users as a column in a transaction table and summing it across months produces a total several times larger than true MAU, because the same active users get counted again in every period they remain active. Storing current MRR on every subscription event row and summing it produces cumulative MRR rather than the point-in-time figure the business actually wants, the same semi-additivity error that makes periodic snapshots the correct pattern for MRR.
The design rule that follows from all three traps is straightforward: every measure column in a fact table should carry a documented additivity class, fully additive, semi-additive, or non-additive, recorded wherever the organization keeps its metric definitions. dbt's semantic layer supports this directly through a non_additive_dimension parameter on measures, built specifically for cases like bank account balances where aggregation across certain dimensions produces incorrect results. Labeling additivity this way turns a fact table from a set of columns that happen to be numeric into a contract: it tells every BI tool and every analyst querying the table which aggregations are legal and which will produce a number that looks right and isn't.
Sources
- Modeling Fact Tables in Warehouse - Microsoft Fabric
- Periodic Snapshot Fact Tables - Help - dbt Community Forum
- Aggregating Facts - Mastering Data Warehouse Aggregates: Solutions for Star Schema Performance [Book]
- Building real-time, event-driven applications with Database CDC feeds and Fabric Eventstreams DeltaFlow (Preview)